
![]()
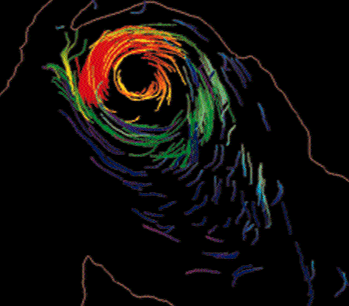
HUMAN BLOOD FLOW: New computer visualization techniques developed by Michael Buonocore, medical physicist at the UC Davis Medical Center, turn large data sets from magnetic resonance imaging into moving three-dimensional images that allow non-invasive assessment of normal and abnormal blood flow. This picture shows a vortex within the surgically grafted aorta of an elderly patient who has no energy to exercise. The color coding--red, yellow, green, blue and purple--reveals that the blood has been circulating in the vortex for progressively longer times, up to 11/2 heartbeats. Generated on a Silicon Graphics workstation, Buonocore's images have been used in both clinical and basic research projects.